This lesson walks through the steps to load the 2nd Data Table (Actual), build a relationship to the Lookup Table, and add actual sales to the budgeted sales Pivot Table.
Load the Actual Data Table
Start with the workbook created from the last exercise, Building Relationships, or download this file.Load the Actual data to the exercise workbook by performing the following steps:
- Download the Actual file by selecting the Download icon below.
- ↑
- In the exercise workbook, go to the Data tab, Get Data, From File, From Workbook.
- Browse to select the downloaded Actual file and Import.
- On the Navigator, select the Table, then Transform Data (or Edit).
- Rename the Query, Actual_Data.
Establish a common field
The Actual file lists actual sales by day in the format MM/DD/YYYY, The Date Lookup Table is rolled up to the monthly level. Therefore, we need to create a column in the Actual query that we can build a relationship with.
Choose the Date of Sale column, and then on the Add Column tab, select Date, Month, Start of Month.
The query is now loaded and transformed. Go to the Close & Load drop down menu, Close & Load To, Only Create Connection, Add this data to the Data Model and select Ok.
Build a relationship
In the Power Pivot menu, select Manage to open Power Pivot. On the Home tab, select Diagram View.Rearrange the Actual_Data query so the Data Table looks up to the Lookup Table.

On the Actual_Data box, select the Start of Month and drag up to the Start of Month on the Date_LU.
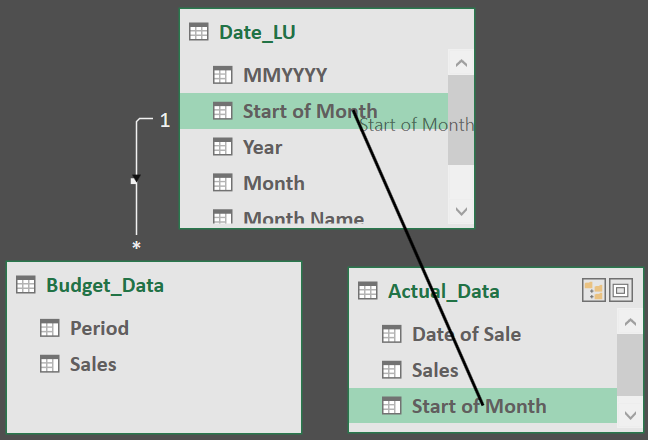
The connector should indicate a 1 next to the Date_LU Table, since this Table holds unique values.

💥BEST PRACTICE TIP
Always connect the Data Table to the Lookup Table. Do not connect Data Tables to each other.💥
Pivot Budget and Actual on 1 Pivot Table
In the Pivot Table Field List, there are now 3 queries to choose from including Actual_Data.

With the cursor in the Month Name column of the Pivot Table, right click and Sort by Ascending.
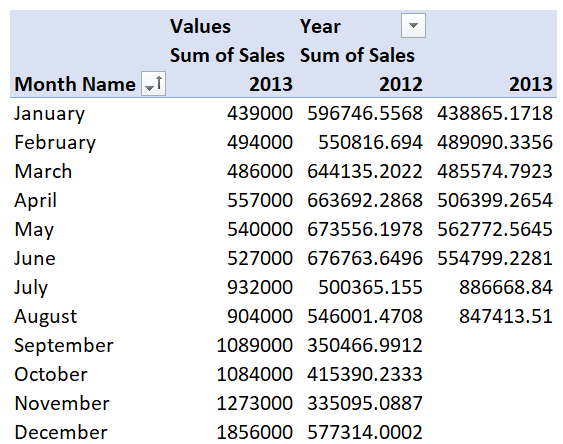
It's not polished yet, but the goal has been achieved. The Pivot Table reflects 2 Data Tables and two different sales figures: budget and actual.
In this lesson, you learned how to:
- Handle relationships when there are two Data Tables; and
- Pivot 3 data sets on 1 Pivot Table.
No comments:
Post a Comment