Just joining the blog? Explore prior lessons on Relationships here.
Ah, relationships: they always seem to have at least some problems.
In Power Pivot, the most obvious alert to a relationship problem is when all the values in a Pivot Table are the same.
Let's walk through a few examples illustrating how things go wrong, so you can spot and solve issues when they occur in your own data sets.
The Data
For this exercise, there are two data sets: a Costs Table and a Sign Table. Download the data file by selecting the icon above the arrow below.
↑
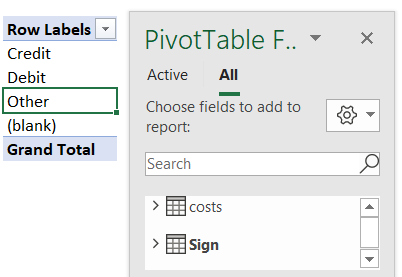
Let's explore the data in the Tables. The Sign Table is a Lookup Table for the natural sign based on transaction type. There are the two typical accounting transaction types (debit and credit) plus an additional type, Other (for statistical transactions).
The Costs Table contains 12 accounting transactions; most transactions have a typical Transaction Type of Credit or Debit, but 2 are listed as Total and 1 is listed as Zero.
Lookup Table field as value
On the Pivots tab, 2 Pivot Tables have been built which essentially are trying to gather the same information: what is the count of the type of each transaction? The first set is pulling in to the rows area Transactions Type from the Costs Table (Data Table). The second set is pulling in Type from the Sign Table (Lookup Table).
Let's look first at the impact of pulling in to the values area of each Pivot Table the type from the Lookup Table (Type from the Costs Table).
Immediately noticeable is the left Pivot showing the count of Type as 3 in each row. Since Zero occurs only once in the Costs data, how can there be a count of 3? If the Grand Total is 3, how can each row also be 3?
Let's build the relationship by going to the Power Pivot menu on the ribbon, then select Manage. Inside Power Pivot, select the Diagram View. Remember that the Data Table is the Costs Table and the Lookup Table is the Sign Table. So we'll need to have the Costs Table lookup to the Sign Table. To do so, in the Costs Table, select Transaction Type and drag over to the Sign Table Type field. This connects the two fields establishing a Relationship.Looking at the Pivot Tables now, you'll note nothing has changed. Further exploration is required.
Power Pivot gives us a hint to why the left Pivot is returning 3 for each Transaction Type. When the Relationships alert shows up, it usually means we need to look at our relationship or in this case, build one.
Build the Relationship
The relationship error message isn't extremely helpful; selecting Auto-Detect shows "No new relationships found". Selecting Create opens a box to Create Relationship, but requires understanding which type should be the Foreign and Primary keys. I prefer instead to use the Power Pivot menu.
Data Table field as value
In the exercise above, type was pulled in to the Pivots from the Lookup Table, Sign. This returned a value of three which represents the number of types listed in the Lookup Table (Credit, Debit, Other). Each type being represented once, the Pivot on the right provided the correct count of the lookup, but not the count of the transactions by type.
Both Tables show a Count of 12. The left Pivot shows the count for Zero and Total, whereas the right Pivot only shows Blank, since those labels aren't in the Sign Table. On the surface, it seems like the left Pivot is the correct approach.
Let's perform one more test.
The Final Test
Let's add the Sign to both Pivots.
Now this view highlights an important issue with the left Pivot. While it's not returning a result of 3 in each row of the Pivot, showing 1 as the result is also incorrect. If you were to write Measures off the Table like this, your results would be inaccurate.
Why did this return the wrong result? The cause is because the left Pivot is asking for data from the Lookup Table (Sign) and from the transaction table (Transaction Type). In Power Pivot, Lookup Tables can see in to Data Tables, but Data Tables can't see in to Lookup Tables. Regardless of the rows field, the relationship flows down from the Sign Table to the Costs Table.
When I first started using Power Pivot, I frequently had results where all rows were the incorrectly the same frustrating number.
💥BEST PRACTICE TIP
Always use the columns from the Lookup Table, not the Data Table, as the fields in the Pivot. If the columns from the Data Table are used, the Pivot can not correctly see the Lookup Tables or other Data Tables, and the Pivot Table will return inaccurate results.💥
Now that you know the Best Practice Tip, the right approach to building these Pivots was the Pivot on the right. Since the values area includes fields from both the Lookup and Data Tables, the rows (and column) areas can only include fields from the Lookup Table.
In this lesson, you learned:
- Always use the columns from the Lookup Table, not the Data Table, as the fields in the Pivot;
- Always build relationships where the data table lookups to the lookup table; and
- Just because it looks right, doesn't mean it is. Robustly test for accuracy.
Prior post: Measures: Right& Wrong
Next post: Error checking


No comments:
Post a Comment