Just joining? Explore prior lessons here.
When building a Pivot Table using Power Pivot, a key advantage is the ability to combine multiple datasets in one Pivot Table.

However, it can be very easy to end up with multiple datasets with virtually the same name. This can result in a user selecting the wrong dataset.
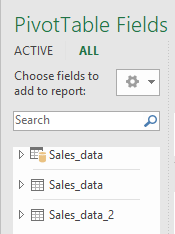
Let's explore the three similarly named datasets shown above.
The Data Model

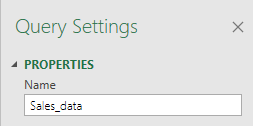
This scenario started with an Excel Table named Sales_data.

Then, the Excel Table was loaded to Power Query, creating a query named Sales_data.
Once work was complete in Power Query, the query was Closed & Loaded as a Table and added to the Data Model. The output Table by default was named Sales_data_2.

A Power Pivot Table
Next, a Pivot Table was created using the Data Model.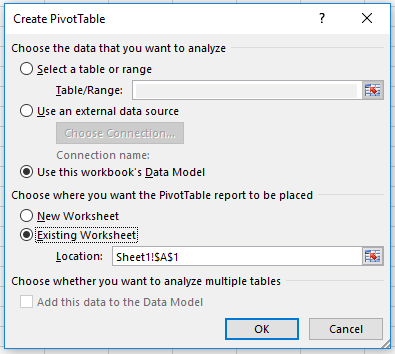
The result is there are now 3 datasets to choose from when building a Pivot Table. This occurred because the Table, query, and output query are all part of the Data Model (the source for a Power Pivot Table).
Which one is which?
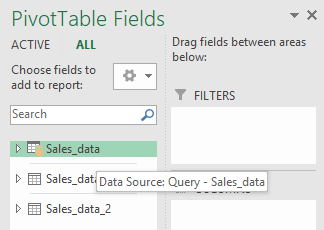
The first dataset has an icon which resembles an Excel Table with a database icon. Hovering over the first dataset name tells us the source for this dataset is "Query - Sales_data". This is the database query which was created in Power Query. When building a Power Pivot Table, use the dataset sourced from the query; it is differentiated by the database icon.

Hovering over the final dataset reveals the source as the Table, Sales_data_2, which is on the Query Output tab in cells A1:D7. This is the Table which was the output of the query when Power Query was Closed & Loaded To.

Hiding "extra" datasets
Now that you know which dataset to choose, prevent future errors by hiding the other datasets from yourself and others.

 On the Power Pivot tab, select Manage. In the Power Pivot data view, Microsoft decided to make things really confusing by renaming the 2nd dataset to Sales_data1. Next steps, we are looking to keep only Sales_data visible in the Pivot Table fields.
  Right click on the tab named Sales_data1. Select the option "Hide from Client Tools".
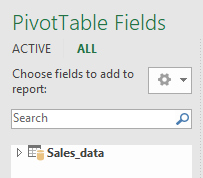
Repeat with the tab Sales_data2. Then close.
Now only the query dataset is visible.
Prevention

Above we identified three sources of datasets: the input Excel Table (or source), the query created from the source, and the output Excel Table created from the query. However, the dataset sourced from the query is almost always the only one we need.
You can avoid two of three scenarios from occurring by altering the input and the output:
- Change the input. Instead of starting in the workbook which contains the Sales_data table, create a new workbook. Then, load the table to Power Query From File, From Workbook. This creates the query, but eliminates the dataset created from the Excel Table, or source.
- Change the output. When you Close & Load the query, load to a Pivot Table or Connection Only. This eliminates the dataset created from the output Excel Table created from the query.
In this lesson, you learned how to:
- Identify a dataset created from a Power Query query;
- Distinguish between datasets created from Excel Tables, from queries, and from the Close & Load as a Table process;
- Hide datasets which aren't needed; and,
- Prevent multiple versions of similar datasets from showing in a Pivot Table.
No comments:
Post a Comment